POSTGAME SCREENS:
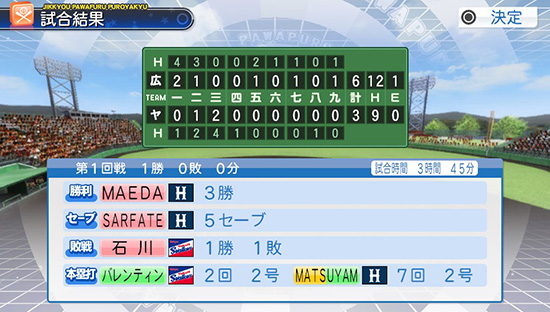 |
| The screen shows Maeda getting the win, Sarfate getting the save, Ishigawa getting the loss, and Balentien hit his 2nd homerun in the 2nd inning, and Matsuyama got his 2nd homerun in the 7th inning. |
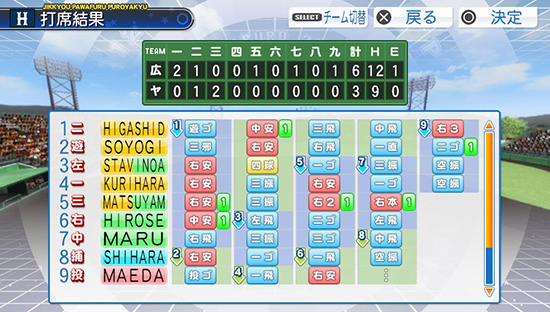 |
| This shows the results of each at-bat. Red are hits, blue are outs and yellow walks. Green boxes are RBI's and the little arrows going down denote inning. |
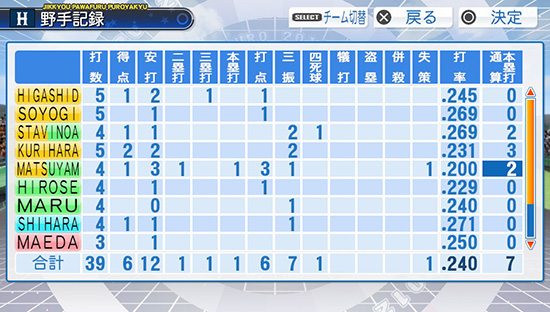 |
| AB - Runs - Hits - 2B - 3B - HR - RBI's - Strikeouts - BB - Sac Bunts - Steals - GIDP - Errors - Batting Avg - Season HR's |
 |
| IP - #Pitches - #Batters Faced - Hits - Strikeouts - BB - Runs - Earned Runs - WIld Pitches - HR - ERA |
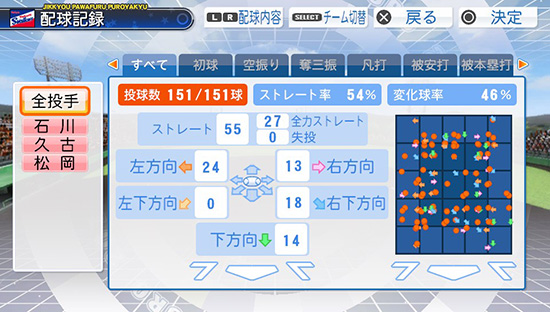 |
| Pitch distribution chart, showing how the pitches were scattered. In the top section you'll see that there were 151 total pitches with 54% of them fastballs and 46% breaking balls.
Middle section: At top is Standard Fastballs thrown (55), Power Fastballs (27) and Bad Releases (0). Below that you'll see how many pitches were thrown left, right, down & away, down & in and down. Box @ right: Note the color of the arrows - they indicate the pitch type. So pink arrows are pitches that broke to the right, and green were breaking pitches that dropped down. |
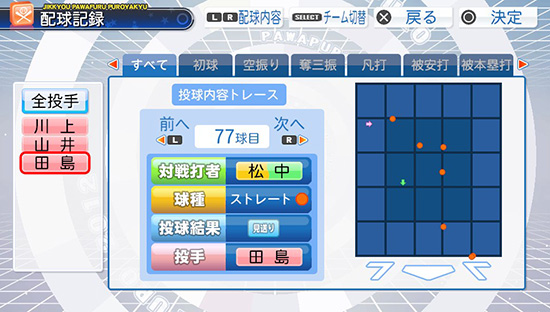 |
Here you can see the result of every single pitch! The box in the middle says:
|
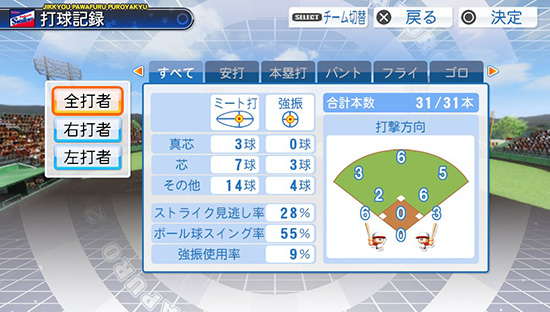 |
| How the batters performed. Using contact swing, 3 balls were squared up perfectly, 7 were near the sweet spot, and 14 were hit outside the sweet spot. When using power swing, 0 balls were perfectly hit, 3 were near the sweet spot, and 4 were outside the sweet spot.
At the bottom you can see that the team took 28% of strikes looking, swung at 55% of Balls, and only used power swing 9% of the time. |
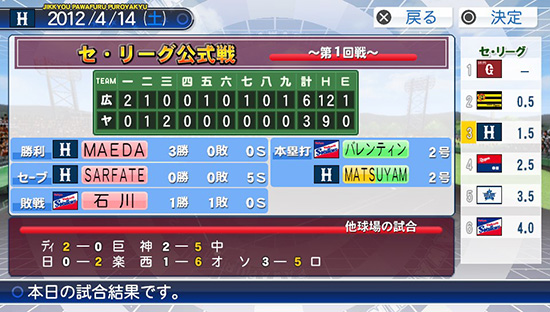 |
| Another post game screen showing Maeda now up to 3 wins, Sarfate up to 5 saves, and Ishigawa now 1-1. At the bottom are results from other games, and on the right are the standings. |

